Age Band × Cohort Size. Unspent stock, and Spent flow.
Subscribe to the Satoshi Sanctum Tier while spaces are still available and enjoy unlimited & unrestricted access to our exclusive, Institutional Grade Bitcoin UTXO Age Band by Cohort Size data for both Spent (Flow) & Unspent (Stock) for every day since 3rd January 2009 to the present day. This provides access to over 16 years-worth of data, with 56 cells daily for the 8 Bands by 7 Cohorts, including truly Institutional in structure data for Realized Cap USD, Market Cap USD Average Cost Basis USD, (Un) Realized Profit / Loss USD, for every one of those 56 combinations across every day of Bitcoin’s history. Data is available both over the API as JSON via MS Excel/ Power BI etc, but crucially also via our Website in the form of over 50+ Charts dedicated to this exclusive, powerhouse resource. Access is reserved for Satoshi Sanctum Tier only; with Tier Space limited to just 50 – expect these to sell fast so get a space now while you still can.
Satoshi Sanctum tier members get exclusive access to over 50 charts related to this Age Band and Cohort story, for both Unspent and Spent output data. Those charts open only with a valid Satoshi Sanctum API key, from the Charts sign-in page.
Satoshi Sanctum adds two doors the other tiers do not get. This page is the first. Eight age bands, from under 155 days out to 15 years and older, crossed with seven cohort sizes, from Shrimp to Humpback. Fifty-six cells. The unspent grid says who holds what. The spent grid says who moved what. Put them together and you can see whether the coins sitting in a whale’s 5–10 year band are the same pile that actually left.
On top of raw BTC and counts, Cost Basis Distribution attaches a true average entry to each cell — Realized Cap in USD, and Average Cost Basis in USD, taken from the creation price of the outputs in that cell. Stock is marked to market. Flow is scored on what it sold for. Chainwarden and Mining Oracle do not open this surface. It is Satoshi Sanctum, and it is rare among Bitcoin data desks. The second Sanctum door, output-by-output access to the Spent and Unspent tables, sits beside it. This page stays on the 56-cell map.
Stock
Unspent
Who holds what. Each cell is the bitcoin still sitting in that age and that size: output counts, raw BTC, and — on the live window from January 2009 — Realized Cap in USD, Average Cost Basis in USD, the bucket’s market cap, and Unrealized Profit & Loss marked to today’s price.
Flow
Spent
Who moved what. Each cell is the coins of that age and that size that left the set: BTC spent, and the sale itself — Spent Proceeds in USD, the cost those outputs carried, and Realized Profit & Loss. A quiet cell is a fact. It is not a missing column.
This is the institutional size × age family of the Enterprise API. It is not a HODL-wave total, not a single “whale supply” ticker, and not an address-balance league table. It is a 7 × 8 reconstruction of Bitcoin’s unspent set (and, separately, of coins that moved that day) sliced by UTXO size and coin age.
Every full-grid day is 56 squares. Each square answers one joint question:
How many bitcoin of this size class are this old (or moved at this age today), and what did those coins cost versus what they are marked at?
Unspent, flattened. One calendar date on Unspent Full Age Band by Cohort with flat format (or the 56 objects inside cells on grid format) is not “56 numbers.” Each square carries the identity of the bucket (Date, Cohort Band, Age Band) plus the stock itself (Value in BTC, UTXO Count, Address Count), four share measures (Percent of Circulating, Percent of Unspent Sum, Percent of Cohort, Percent of Age Band, and Percent of Long-Term Holder where the band is Long-Term Holder), and the dollar stack (Realized Cap in USD, Average Cost Basis in USD, Bucket Market Cap in USD, Unrealized Profit and Loss in USD). That is 16 fields per square. Across the full 7 × 8 that is 56 × 16 = 896 values per date in a spreadsheet — enough to rebuild who holds the float, how fragmented the pile is, what share of circulating / cohort / age / Long-Term Holder it is, what those coins paid, what they mark at today’s spot, and whether that cell is in paper profit or underwater. A Sanctum 25-day pull is up to 22,400 unspent values in one file. Quota still counts 25 days.
Spent, flattened. The sister call on Spent Full Age Band by Cohort uses the same 56 squares, but every field is flow that day, not stock. Each square carries identity plus Spent BTC, UTXO Count, Address Count, realized dollar Profit and Loss and a SOPR-style multiple (Realized Profit and Loss in USD, Realized Profit and Loss Ratio), four flow-share measures (Percent of Day Spent, Percent of Cohort Spent, Percent of Age Band Spent, Percent of Long-Term Holder Spent), cost and proceeds (Realized Cap in USD, Average Cost Basis in USD, Spent Proceeds in USD), and the audit identity Profit and Loss from Cost Basis Distribution. That is 17 fields per square. Across the grid that is 56 × 17 = 952 values per date — enough to see who actually moved, at what age, at what cost, at what exit, at what multiple, and how large that tape was versus the rest of the day, the rest of that cohort, and the rest of that age band. A Sanctum 25-day pull is up to 23,800 spent values. Again, the meter is days, not 952.
Exclusive Access to 80+ CBD Charts on Satoshi Sanctum Tier
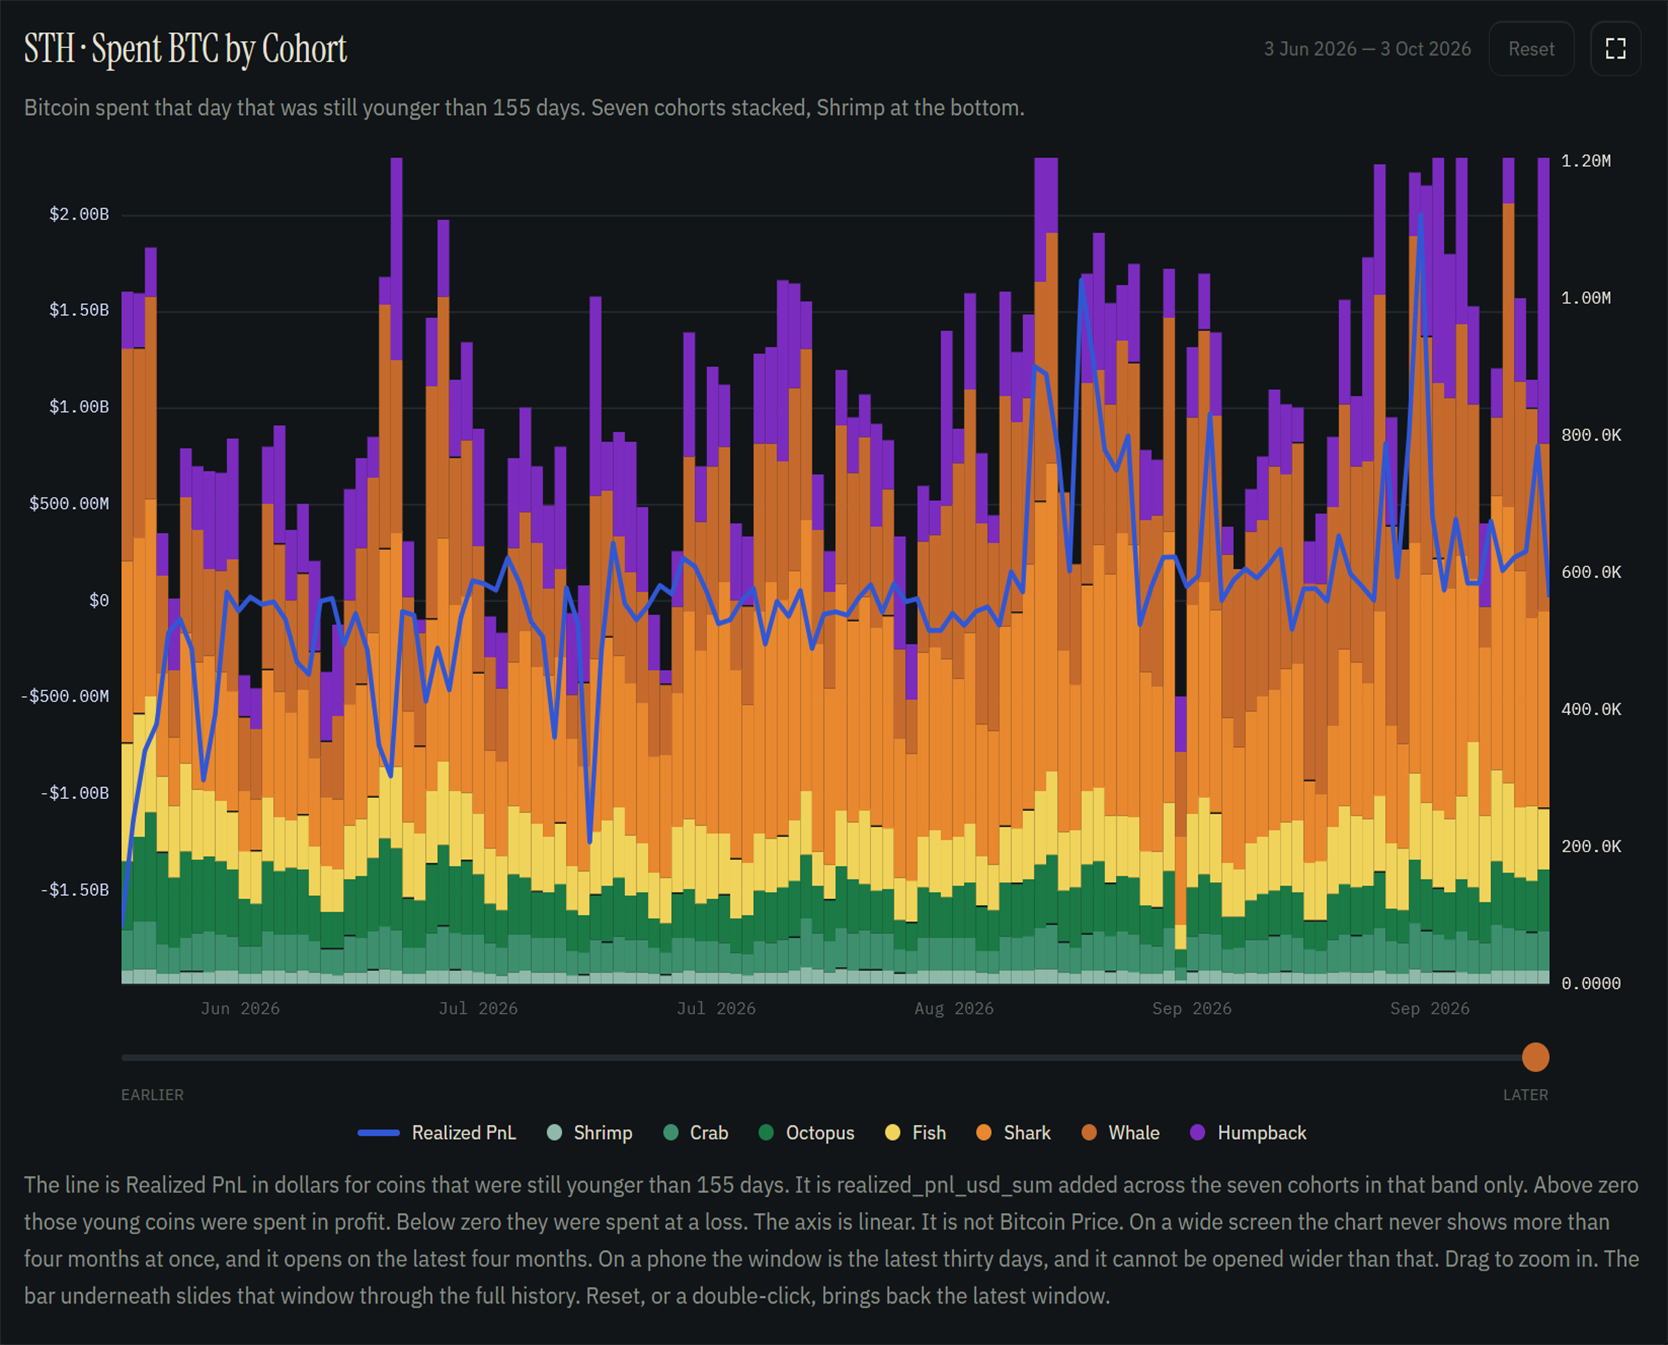
Below is a small sample of the exclusive 80+ private charts as a Satoshi Sanctum Tier member. These are unrestricted, with full access back to 2009. Explore the full gamut of exhaustive Cost Basis Distribution data for both Unspent Stock & Spent Flow, across a vast array of Charts.
01 / 10 · STH · Spent BTC by Cohort
Why Subscribe to Satoshi Sanctum Tier?
Members use this family for:
Ownership maps that HODL waves cannot draw (size and age together)
Distinguishing fragmented retail stock from concentrated old slabs
Cost basis and unrealized Profit and Loss inside a square, not only network-wide MVRV
Day-of spend tape: who actually moved, at what age, at what multiple
Pairing with Long-Term Holder / Short-Term Holder and HODL–spent boards without pretending those boards are a 7×8
01 / 05
01 · The map
Fifty-six cells, not one price
Eight age bands crossed with seven cohort sizes. Shrimp through Humpback. Coins younger than 155 days, out to 15 years and older. One cell is one age, one output size, one day. The page is titled Cost Basis Distribution because a true dollar entry sits on those cells. The object underneath is the Age Band × Cohort Size set, on both sides: Unspent stock, and Spent flow.
The family answers the questions desks actually ask once HODL waves and Long-Term Holder percent stop being enough:
Who holds the float — shrimp dust or humpback slabs — and at what age?
Is “high Long-Term Holder percent” 155-day coins or 10-year-plus coins?
When old coins move, is it 1 BTC of 15-year-plus crab or 50k BTC of 5–10-year whale?
What did that cell pay (Realized Cap / Average Cost Basis) versus what it is worth (Bucket Market Cap / Spent Proceeds)?
Is the paper / realized Profit and Loss concentrated in one square or spread across the grid?
Hear a letter
One print, read aloud
This is the essay format a Sanctum key receives. The print is 2 October 2026, from the Age Cohort 5-year-plus spend letter. The window requested ended 2026-10-03. Press play. The letter is not printed on this page.
Download a full sample Transcript here as an MS Word Document or as a PDF from the 5yr+ Age Band Spend SQL Endpoint taken from 2nd October 2026. The PDF keeps the same headings in its navigation pane.
Fifteen queries · Sanctum only
86 to 100
Of the 100-plus SQL endpoints on the Enterprise API, Chainwarden upward, fifteen are reserved for Satoshi Sanctum. They are queries 86 to 100 in the API Documentation, where each one is written up in full. Five of them — 86, 87, 88, 89 and 90 — return an essay of about 1,500 words on every day, week, or month you ask for. The other ten are the full grids, the single cells, and the raw tapes underneath the letter.
Try the grid before you take a seat. No API key. Locked to 1 October 2026. The free sample is one day of query 91, Full Age-Band by Cohort — Unspent, and query 92, Full Age-Band by Cohort — Spent. Rows are sorted smallest cohort to largest, then youngest age band to oldest. Any date you append is ignored. UNSPENT — follow the link here for the free sample. SPENT — follow the link here for the free sample. The full history of both endpoints still needs a paid, valid API key and an active Satoshi Sanctum subscription. Every other day, and queries 86 to 100, stay behind that key.
Query
Endpoint
Returns
86
Age Band × Cohort Size — Sanctum Letter — Daily
Essay, about 1,500 words
87
Age Band × Cohort Size — Sanctum Letter — Weekly
Essay, about 1,500 words
88
Age Band × Cohort Size — Sanctum Letter — Monthly
Essay, about 1,500 words
89
Age Band × Cohort Size — Cost Basis Distribution — Time Trends
Essay, about 1,500 words
90
Age Band × Cohort Size — Spending Patterns, 5yr / 10yr / 15yr+
Essay, about 1,500 words
91
Full Age-Band by Cohort — Unspent
Grid or raw series
92
Full Age-Band by Cohort — Spent
Grid or raw series
93
Full Age-Band by Cohort — Cells — Unspent
Grid or raw series
94
Full Age-Band by Cohort — Cells — Spent
Grid or raw series
95
Age Cohort 5y Plus Spend — Daily — Raw Data
Grid or raw series
96
Age Cohort 5y Plus Spend — Weekly — Raw Data
Grid or raw series
97
Age Cohort 5y Plus Spend — Monthly — Raw Data
Grid or raw series
98
Spent Outputs Enriched — Daily — Raw Data
Grid or raw series
99
Spent Outputs Enriched — Weekly — Raw Data
Grid or raw series
100
Spent Outputs Enriched — Monthly — Raw Data
Grid or raw series
True dollar cost basis on each cell runs on the live window from January 2009: providing more than 15 years of deep, rich, dense Bitcoin Cost Basis Distribution data. The product is institutional in structure. It is not a buy or sell oracle.
Membership
Fifty seats. Then the door shuts.
Satoshi Sanctum is $65 a month, 50 spaces. Age Band × Cohort Size, the letters, and the output-level tables open there. Annual billing takes 20% off.